plt.figure(figsize = (12,6))
plt.title('응답자의 지역')
sns.barplot(x = df.index,y = df.values)
plt.ylabel('응답자 수')
plt.xticks(rotation = 90)
plt.show()# data = ~~ 값을 안넣고 x.y만 넣었다는 경고에러 발생함.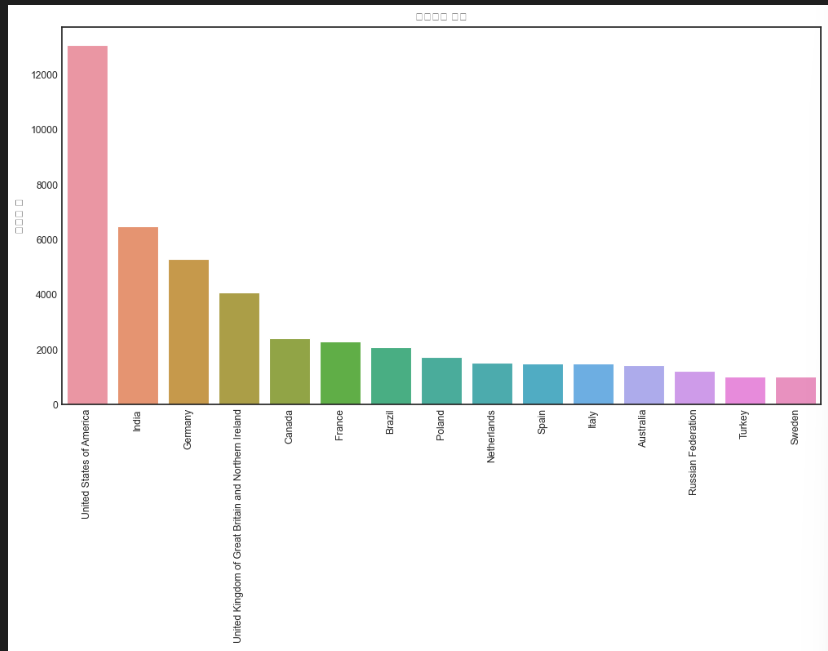
df= survey_df['Age'].value_counts().sort_index()
plt.figure(figsize = (12,6))
plt.title('what is your age')
plt.ylabel('응답자 수')
idx = df.index
order = [idx[7],idx[0],idx[1],idx[2],idx[3],idx[4],idx[5],idx[6]]
sns.barplot(x = df.index,y = df.values,order = order)
plt.xticks(rotation = 90)
plt.show()# data = ~~ 값을 안넣고 x.y만 넣었다는 경고에러 발생함.

#plt.figure(figsize=(12,6)) # 그림 사이즈 키우는게 다임
gender = survey_df['Gender'].value_counts()
sizes = gender.values /gender.values.sum()*100
plt.pie(sizes,labels = gender.index,autopct='%1.1f%%', shadow=True, startangle=180)
plt.show()
# 대다수가 남성임을 알 수 있었다.

survey_df['EdLevel'].value_counts()

plt.ylabel('응답자 수')
idx = df.index
order = [idx[7],idx[0],idx[1],idx[2],idx[3],idx[4],idx[5],idx[6]]
sns.barplot(x = df.index,y = df.values,order = order)
plt.xticks(rotation = 90)
plt.show()# data = ~~ 값을 안넣고 x.y만 넣었다는 경고에러 발생함.

df= survey_df['EdLevel'].value_counts()
plt.title(schema_raw['EdLevel'])
plt.xticks(rotation = 90)
plt.xlabel('count')
sns.countplot(data = survey_df ,y = 'EdLevel')
plt.ylabel(None) # None을 넣으면 label에 아무것도 안들어간다.
plt.show()

df= survey_df['EdLevel'].value_counts()
plt.title(schema_raw['EdLevel'])
plt.xlabel('Percentage')
plt.ylabel(None) # None을 넣으면 label에 아무것도 안들어간다.
sns.barplot(x = df*100/survey_df['EdLevel'].count(),y = df.index)
plt.show()

df = survey_df['Employment'].value_counts().head(15)
sns.barplot(x = df*100/survey_df['Employment'].head(15).count(),y = df.index)
plt.title(schema_raw['Employment'])
plt.xlabel('Percentage')
plt.ylabel(None) # None을 넣으면 label에 아무것도 안들어간다.
plt.show()

schema_raw.DevType

중복 선택이 가능한 데이터를 하나씩 쪼개는 방법.
- 중복선택이 가능하여 데이터의 가짓수가 많아짐
- 최소한의 단위로 DevType을 쪼개서 저장해야 좋지 않을까?
survey_df.DevType

survey_df.DevType.value_counts().index
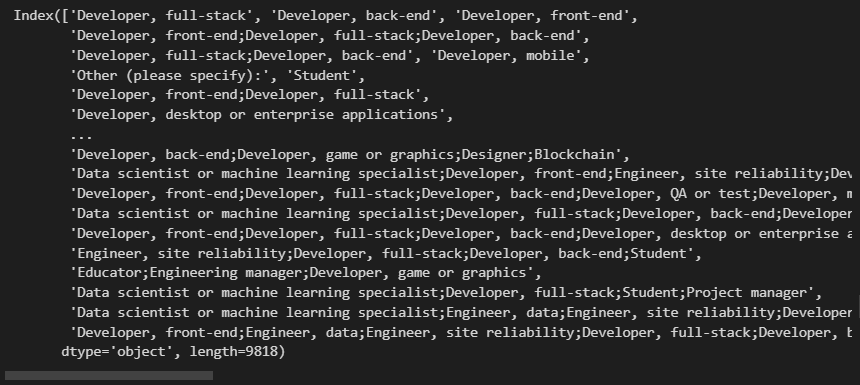
#내 코드
def decomp(Sery):
    k = set()# set 말고 전체 column들을 구해서 일단 넣고 unique처리해서 column으로 쓸수도 있었겠다.
    Sery = Sery.fillna('None')
    df = pd.DataFrame()

    for i in Sery.value_counts().index: # set으로 중복 값 없는 column 만들기
        for j in i.split(';'): # 여기서 for문 안돌리고 str로도 가능
            k.add(j)
    key = list(k)
    key.remove('None')
    for i in list(key):# 만든 column마다 함수 적용해서 True인지 False인지 구분하기.
        df[i] = Sery.apply(lambda x : True if i in x else False)
    return df

dev_type_df =  decomp(survey_df.DevType)
dev_type_df

#선생님 코드
def split_multicolumn(col_series):
    # 반환할 DataFrame이자 최초의 col_series도 담는다.
    result_df = pd.DataFrame(col_series.values, index=col_series.index, columns=["DevType"])
    # result_df = col_series.to_frame() --> 위의 코드와 같다.
    # 기술 스텍 목록을 담았다가 마지막 반환할 때 인덱싱으로 활용
    options = []
    # NaN 값을 갖는 row를 제외하고 반복
    for idx, value  in col_series[col_series.notnull()].items():
        # value를 가져와 ';'를 기준으로 분리하여 각 기술 스텍 문자열 리스트를 만든다.
        for option in value.split(';'):
            # 현재 option이 result_df.columns에 없으면 추가한다.
            if option not in result_df.columns:
                options.append(option)
                result_df[option] = False
            # 파싱한 기술 스텍에 해당하는 column의 값에 True를 넣는다.
            result_df.at[idx, option] = True
            # result_df.loc[idx, option] = True
    return result_df[options]
ress = split_multicolumn(survey_df['DevType'])
# <https://pandas.pydata.org/docs/reference/api/pandas.DataFrame.at.html>
# 상욱형 코드
def split_multicolumn(Series):
    df = pd.DataFrame(False, columns = (Series.dropna().str.split(';').str[0].unique()), index = Series.index)
    # for idx, rep in Series[Series.notnull()].str.split(';').items:
    #     for one in rep:
    #         df.at[idx, one.strip()] = True
    # 아래 코드를 위 주석으로 바꿀 수 있음 NaN을 어떻게 처리할것이냐에 대한 차이.
    for idx, rep in Series.str.split(';').items():
        # NaN이 아닌 값을 분기
        if isinstance(rep, list):
            for one in rep:
                df.at[idx, one.strip()] = True
        else :
            pass
    return df
res = split_multicolumn(survey_df['DevType'])
survey_df['DevType'].str.split(';')

survey_df['DevType'].str.split(';').str[0]#.unique() 유니크 써서 중복없는 column만든다
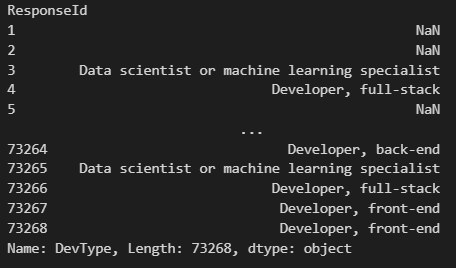
total = dev_type_df.sum().sort_values(ascending = False).sum()
devtype_percentage = dev_type_df.sum().sort_values(ascending = False)/total*100
#devtype_percentage.sum()
devtype_percentage
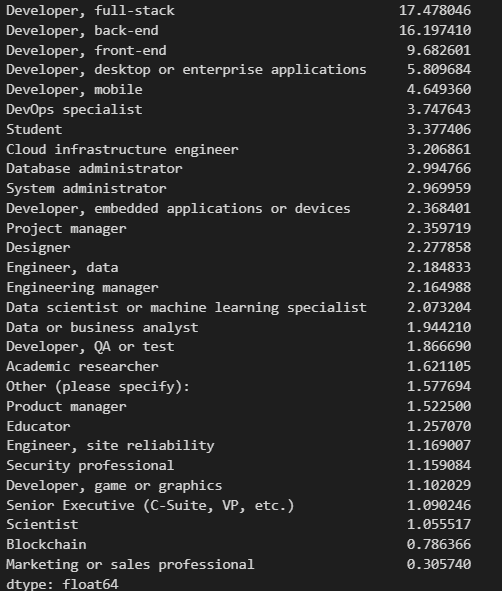
# 위에서 얻은 자료로 표를 만들어보는 예제
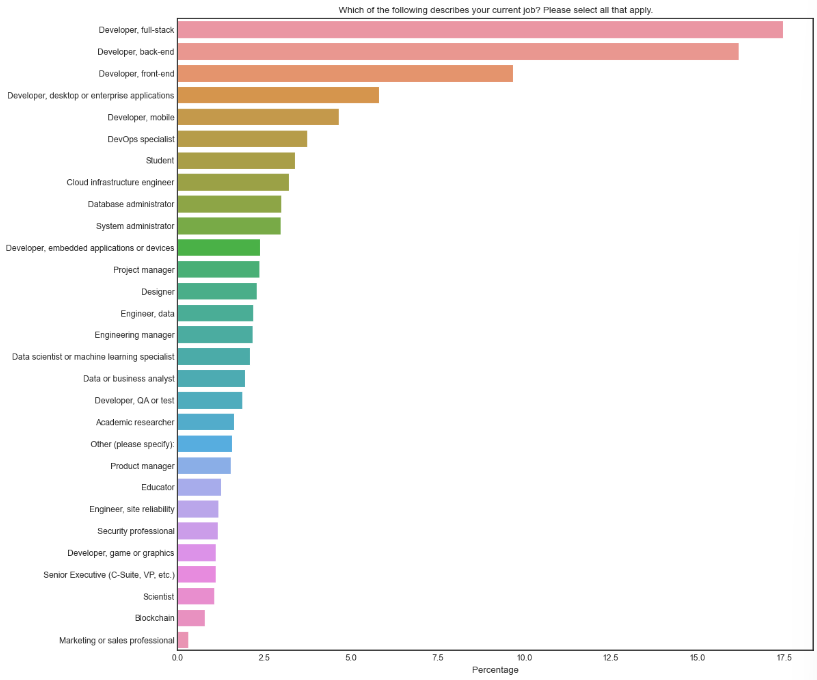
plt.figure(figsize = (12,12))
sns.barplot(x =devtype_percentage.values,y = devtype_percentage.index)
plt.title(schema_raw.DevType)
plt.xlabel('Percentage')
plt.ylabel(None)
plt.show()
# 전체 유저 중에서 아까 만든 함수를 적용하여 어느 언어가 많이 사용되는지를 표로 만들어보자.
dev_type_df =  decomp(survey_df['LanguageHaveWorkedWith'])
val = dev_type_df.sum().sort_values(ascending = False)
total = val /val.sum()*100

plt.figure(figsize = (12,12))
sns.barplot(x =total.values,y = total.index)
plt.title('Language used in the past year')
plt.xlabel('Percentage')
plt.ylabel(None)
plt.show()

# 전체 유저 중에서 한국인들이 사용하는 언어를 보여줘라.
koreans = survey_df[(survey_df['Country'] == 'South Korea') | (survey_df["Country"] == "Republic of Korea")]# 한국인이 2개 이름으로 저장해놨더라.

dev_type_df =  decomp(koreans['LanguageHaveWorkedWith'])
val = dev_type_df.sum().sort_values(ascending = False)
total = val /val.sum()*100

plt.figure(figsize = (12,12))
sns.barplot(x =total.values,y = total.index)
plt.title('Language used in the past year')
plt.xlabel('Percentage')
plt.ylabel(None)
plt.show()

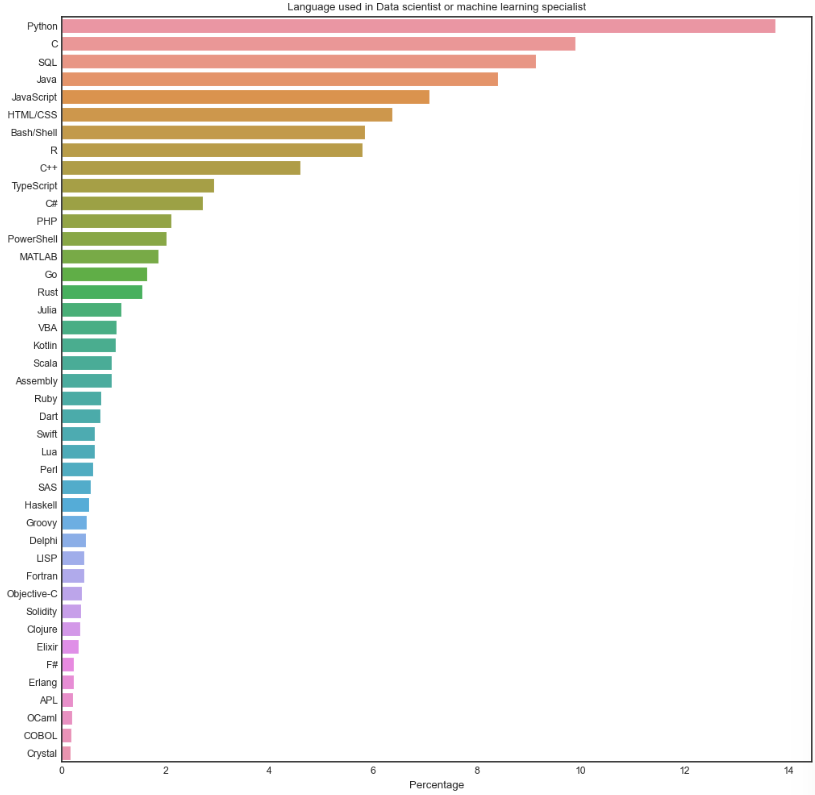
#Data scientist or machine learning specialist 인 사람들 중에서 언어 비율을 표로 만들어서 보는 예제
dev_type_df =  decomp(survey_df['DevType'])
dev = dev_type_df['Data scientist or machine learning specialist']
x = decomp(survey_df[dev]['LanguageHaveWorkedWith'])
val = x.sum().sort_values(ascending = False)
total = val/val.sum() * 100

plt.figure(figsize = (12,12))
sns.barplot(x =total.values,y = total.index)
plt.title('Language used in Data scientist or machine learning specialist')
plt.xlabel('Percentage')
plt.ylabel(None)
plt.show()
want = decomp(survey_raw_df['LanguageWantToWorkWith'])
val = want.sum().sort_values(ascending = False)
total = val/val.sum() * 100

plt.figure(figsize = (12,12))
sns.barplot(x =total.values,y = total.index)
plt.title('Language Want To Work With')
plt.xlabel('Percentage')
plt.ylabel(None)
plt.show()

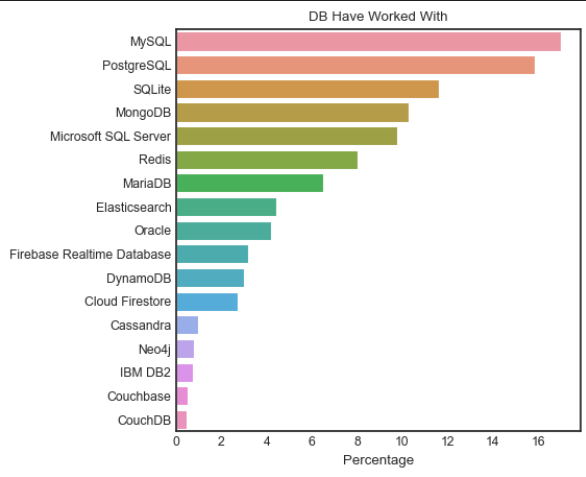
DB = decomp(survey_raw_df['DatabaseHaveWorkedWith'])
val = DB.sum().sort_values(ascending = False)
total = val/val.sum() * 100

plt.figure(figsize = (5,5))
sns.barplot(x =total.values,y = total.index)
plt.title('DB Have Worked With')
plt.xlabel('Percentage')
plt.ylabel(None)
plt.show()
'파이썬 > 응용' 카테고리의 다른 글
| Stack Overflow Data를 사용한 연습 - 1 (0) | 2023.05.03 |
|---|
plt.figure(figsize = (12,6))
plt.title('응답자의 지역')
sns.barplot(x = df.index,y = df.values)
plt.ylabel('응답자 수')
plt.xticks(rotation = 90)
plt.show()# data = ~~ 값을 안넣고 x.y만 넣었다는 경고에러 발생함.
df= survey_df['Age'].value_counts().sort_index()
plt.figure(figsize = (12,6))
plt.title('what is your age')
plt.ylabel('응답자 수')
idx = df.index
order = [idx[7],idx[0],idx[1],idx[2],idx[3],idx[4],idx[5],idx[6]]
sns.barplot(x = df.index,y = df.values,order = order)
plt.xticks(rotation = 90)
plt.show()# data = ~~ 값을 안넣고 x.y만 넣었다는 경고에러 발생함.

#plt.figure(figsize=(12,6)) # 그림 사이즈 키우는게 다임
gender = survey_df['Gender'].value_counts()
sizes = gender.values /gender.values.sum()*100
plt.pie(sizes,labels = gender.index,autopct='%1.1f%%', shadow=True, startangle=180)
plt.show()
# 대다수가 남성임을 알 수 있었다.

survey_df['EdLevel'].value_counts()

plt.ylabel('응답자 수')
idx = df.index
order = [idx[7],idx[0],idx[1],idx[2],idx[3],idx[4],idx[5],idx[6]]
sns.barplot(x = df.index,y = df.values,order = order)
plt.xticks(rotation = 90)
plt.show()# data = ~~ 값을 안넣고 x.y만 넣었다는 경고에러 발생함.

df= survey_df['EdLevel'].value_counts()
plt.title(schema_raw['EdLevel'])
plt.xticks(rotation = 90)
plt.xlabel('count')
sns.countplot(data = survey_df ,y = 'EdLevel')
plt.ylabel(None) # None을 넣으면 label에 아무것도 안들어간다.
plt.show()

df= survey_df['EdLevel'].value_counts()
plt.title(schema_raw['EdLevel'])
plt.xlabel('Percentage')
plt.ylabel(None) # None을 넣으면 label에 아무것도 안들어간다.
sns.barplot(x = df*100/survey_df['EdLevel'].count(),y = df.index)
plt.show()

df = survey_df['Employment'].value_counts().head(15)
sns.barplot(x = df*100/survey_df['Employment'].head(15).count(),y = df.index)
plt.title(schema_raw['Employment'])
plt.xlabel('Percentage')
plt.ylabel(None) # None을 넣으면 label에 아무것도 안들어간다.
plt.show()

schema_raw.DevType

중복 선택이 가능한 데이터를 하나씩 쪼개는 방법.
- 중복선택이 가능하여 데이터의 가짓수가 많아짐
- 최소한의 단위로 DevType을 쪼개서 저장해야 좋지 않을까?
survey_df.DevType

survey_df.DevType.value_counts().index

#내 코드
def decomp(Sery):
    k = set()# set 말고 전체 column들을 구해서 일단 넣고 unique처리해서 column으로 쓸수도 있었겠다.
    Sery = Sery.fillna('None')
    df = pd.DataFrame()

    for i in Sery.value_counts().index: # set으로 중복 값 없는 column 만들기
        for j in i.split(';'): # 여기서 for문 안돌리고 str로도 가능
            k.add(j)
    key = list(k)
    key.remove('None')
    for i in list(key):# 만든 column마다 함수 적용해서 True인지 False인지 구분하기.
        df[i] = Sery.apply(lambda x : True if i in x else False)
    return df

dev_type_df =  decomp(survey_df.DevType)
dev_type_df

#선생님 코드
def split_multicolumn(col_series):
    # 반환할 DataFrame이자 최초의 col_series도 담는다.
    result_df = pd.DataFrame(col_series.values, index=col_series.index, columns=["DevType"])
    # result_df = col_series.to_frame() --> 위의 코드와 같다.
    # 기술 스텍 목록을 담았다가 마지막 반환할 때 인덱싱으로 활용
    options = []
    # NaN 값을 갖는 row를 제외하고 반복
    for idx, value  in col_series[col_series.notnull()].items():
        # value를 가져와 ';'를 기준으로 분리하여 각 기술 스텍 문자열 리스트를 만든다.
        for option in value.split(';'):
            # 현재 option이 result_df.columns에 없으면 추가한다.
            if option not in result_df.columns:
                options.append(option)
                result_df[option] = False
            # 파싱한 기술 스텍에 해당하는 column의 값에 True를 넣는다.
            result_df.at[idx, option] = True
            # result_df.loc[idx, option] = True
    return result_df[options]
ress = split_multicolumn(survey_df['DevType'])
# <https://pandas.pydata.org/docs/reference/api/pandas.DataFrame.at.html>
# 상욱형 코드
def split_multicolumn(Series):
    df = pd.DataFrame(False, columns = (Series.dropna().str.split(';').str[0].unique()), index = Series.index)
    # for idx, rep in Series[Series.notnull()].str.split(';').items:
    #     for one in rep:
    #         df.at[idx, one.strip()] = True
    # 아래 코드를 위 주석으로 바꿀 수 있음 NaN을 어떻게 처리할것이냐에 대한 차이.
    for idx, rep in Series.str.split(';').items():
        # NaN이 아닌 값을 분기
        if isinstance(rep, list):
            for one in rep:
                df.at[idx, one.strip()] = True
        else :
            pass
    return df
res = split_multicolumn(survey_df['DevType'])
survey_df['DevType'].str.split(';')

survey_df['DevType'].str.split(';').str[0]#.unique() 유니크 써서 중복없는 column만든다

total = dev_type_df.sum().sort_values(ascending = False).sum()
devtype_percentage = dev_type_df.sum().sort_values(ascending = False)/total*100
#devtype_percentage.sum()
devtype_percentage

# 위에서 얻은 자료로 표를 만들어보는 예제
plt.figure(figsize = (12,12))
sns.barplot(x =devtype_percentage.values,y = devtype_percentage.index)
plt.title(schema_raw.DevType)
plt.xlabel('Percentage')
plt.ylabel(None)
plt.show()

# 전체 유저 중에서 아까 만든 함수를 적용하여 어느 언어가 많이 사용되는지를 표로 만들어보자.
dev_type_df =  decomp(survey_df['LanguageHaveWorkedWith'])
val = dev_type_df.sum().sort_values(ascending = False)
total = val /val.sum()*100

plt.figure(figsize = (12,12))
sns.barplot(x =total.values,y = total.index)
plt.title('Language used in the past year')
plt.xlabel('Percentage')
plt.ylabel(None)
plt.show()

# 전체 유저 중에서 한국인들이 사용하는 언어를 보여줘라.
koreans = survey_df[(survey_df['Country'] == 'South Korea') | (survey_df["Country"] == "Republic of Korea")]# 한국인이 2개 이름으로 저장해놨더라.

dev_type_df =  decomp(koreans['LanguageHaveWorkedWith'])
val = dev_type_df.sum().sort_values(ascending = False)
total = val /val.sum()*100

plt.figure(figsize = (12,12))
sns.barplot(x =total.values,y = total.index)
plt.title('Language used in the past year')
plt.xlabel('Percentage')
plt.ylabel(None)
plt.show()

#Data scientist or machine learning specialist 인 사람들 중에서 언어 비율을 표로 만들어서 보는 예제
dev_type_df =  decomp(survey_df['DevType'])
dev = dev_type_df['Data scientist or machine learning specialist']
x = decomp(survey_df[dev]['LanguageHaveWorkedWith'])
val = x.sum().sort_values(ascending = False)
total = val/val.sum() * 100

plt.figure(figsize = (12,12))
sns.barplot(x =total.values,y = total.index)
plt.title('Language used in Data scientist or machine learning specialist')
plt.xlabel('Percentage')
plt.ylabel(None)
plt.show()

want = decomp(survey_raw_df['LanguageWantToWorkWith'])
val = want.sum().sort_values(ascending = False)
total = val/val.sum() * 100

plt.figure(figsize = (12,12))
sns.barplot(x =total.values,y = total.index)
plt.title('Language Want To Work With')
plt.xlabel('Percentage')
plt.ylabel(None)
plt.show()

DB = decomp(survey_raw_df['DatabaseHaveWorkedWith'])
val = DB.sum().sort_values(ascending = False)
total = val/val.sum() * 100

plt.figure(figsize = (5,5))
sns.barplot(x =total.values,y = total.index)
plt.title('DB Have Worked With')
plt.xlabel('Percentage')
plt.ylabel(None)
plt.show()

'파이썬 > 응용' 카테고리의 다른 글
| Stack Overflow Data를 사용한 연습 - 1 (0) | 2023.05.03 |
|---|
